Part One of Two Parts
A drunk driver with three passengers in his car went off the roadway at a high speed striking the guide rail in the median with the driver’s side of the car. The car slid along the guide rail until it reached a point where a crack in the guide rail existed as the result of a prior accident. The guide rail had not been replaced after the prior accident.
The lateral force of the car against the guide rail caused the crack to propagate and fracture. The car was impaled by the broken end of the guide rail. The plaintiff in the left rear passenger seat was critically injured and filed suit against the state department of transportation for failing to properly maintain the guide rail. The goal of the litigation graphics package was manifold:
Orient viewers to the roadway, traffic pattern, compass direction, and State Police accident reconstruction.
Integrate the visual evidence into the presentation to show documented physical aspects of the accident in context.
Present the evidence of the prior accident in the same location that caused the crack.
Show the relationship between the two accidents.
Present material science expert analysis of the cracked surface that demonstrated the direction and propagation of the crack in the first accident.
Orientation
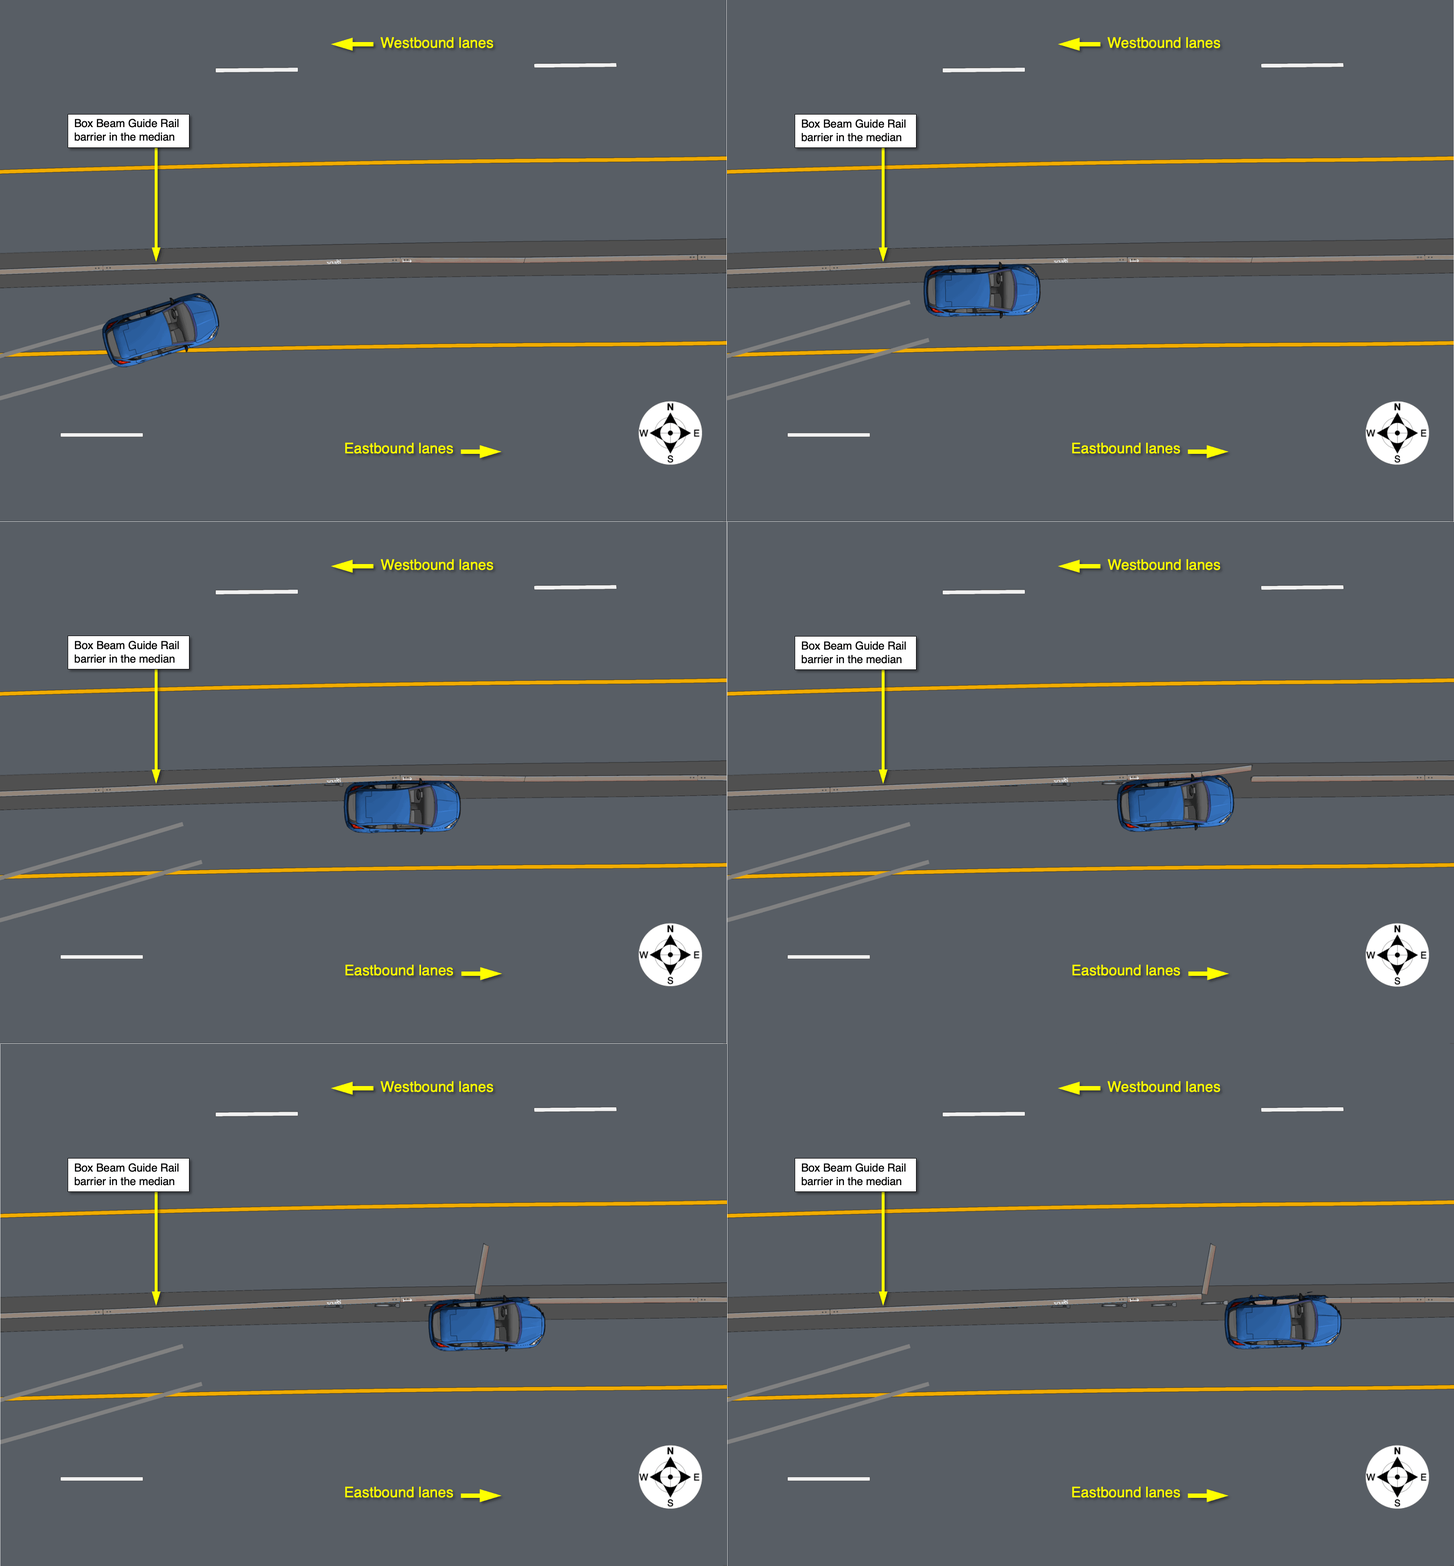
The State Police created a diagram based on their documentation of the accident scene. They included a scale, roadway markings, and the path of the vehicle indicated by tire marks from the roadway to the guide rail and the final resting position. The standard graphic convention for indicating North on a document is to use the top of the page. The State Police did the opposite in their diagram. The diagram was rotated 180º and overlayed on a Google Earth view of the accident location. Both images were adjusted to the same scale. The path of the vehicle was shown in a series of progressive views.
State Police diagram rotated 180º and overlaid at same scale as Google Earth image
A simple 3D computer model of the roadway and guide rail was created based on the modified diagram. Images were generated from the model to illustrate the vehicle positions as it struck and slid along the guide rail. The images show the vehicle motion and the movement of the guide rail as the lateral force of the vehicle pushes it north. The force on the guide rail causes the crack to fracture before the vehicle reaches the fracture allowing the vehicle to strike the fractured end head-on.
3D computer model used to show close view progression of vehicle to fracture in guide rail
Integrate the visual evidence into the presentation
State police photos of the accident scene documented the location and damage resulting from the accident. These images provided visual evidence of the deformation and damage to the guide rail. The visual information was used to approximate the movement and fracturing of the guide rail during the accident.
State Police photos integrated into the presentation to show their context
Present Evidence the Prior Accident was in the Same Location
The first accident in this same location occurred approximately 6 months prior. A driver in the westbound lane lost control in slippery conditions and struck the guide rail with the right rear of their vehicle. The Police report and photos of the accident revealed evidence that this vehicle struck the guide rail in the exact same location where the guide rail failed when struck by the second vehicle six months later. One specific landmark detail stands out in the accident photos from both accidents and links them conclusively - here referred to as the SEND marking on top of the guide rail.
Part Two will conclude with:
Showing the relationship between the two accident sequences.
Presenting material science expert analysis of the cracked surface that demonstrated the direction and propagation of the crack in the second accident.
-
August 2023
- Aug 2, 2023 Introducing: The Expert Witness, a New Novel Aug 2, 2023
-
June 2023
- Jun 9, 2023 Finite Element Analysis Confirms Thermal Behavior of a Masonry Column Jun 9, 2023
-
April 2023
- Apr 27, 2023 3D Roof Fire Reconstruction Apr 27, 2023
-
March 2023
- Mar 24, 2023 Graphic Diagrams Demonstrate Biomechanics Mar 24, 2023
-
February 2023
- Feb 23, 2023 3D Modeling Combined with Weather Data Analysis Illustrates Expert’s Opinion Feb 23, 2023
-
January 2023
- Jan 25, 2023 Scene Documentation Reveals Evidence of Internal Building Failure Jan 25, 2023
-
August 2022
- Aug 25, 2022 Graphic Reconstruction Proves Theory in a Motor Vehicle Accident - Part Two Aug 25, 2022
-
July 2022
- Jul 20, 2022 Graphic Reconstruction Proves Theory in a Motor Vehicle Accident Jul 20, 2022
-
June 2022
- Jun 15, 2022 Litigation Graphics Strategies Explain a Complicated Loss Jun 15, 2022
-
May 2022
- May 17, 2022 Do I Need a Demonstrative Evidence Expert to Illustrate My Testimony? May 17, 2022
-
April 2022
- Apr 14, 2022 Arc Furnace Failure Illustrated Apr 14, 2022
-
March 2022
- Mar 23, 2022 Fire Litigation Exhibit Options Mar 23, 2022
-
February 2022
- Feb 16, 2022 Gas Explosion Investigation Enhanced by 3D Reconstruction of Building and HVAC System Feb 16, 2022
-
January 2022
- Jan 18, 2022 Scene Reconstruction Illustrates Non-Compliant Furnace Installation that Caused a Fire Jan 18, 2022
- Jan 5, 2022 3D Scene Reconstruction of Cold Storage Facility Serves as a Critical Tool in Fire Investigation Jan 5, 2022


